In addition to providing a mechanism for Filtering assemblies to extract or exclude features observed in blob plots, selections can be used to explore datasets by tracking specific scaffolds between views.
Selections can be made in blob view, BUSCO view or table view (see Exploring views). To open the BUSCO view, click on the “Settings” tab and select “busco” in the Settings menu:
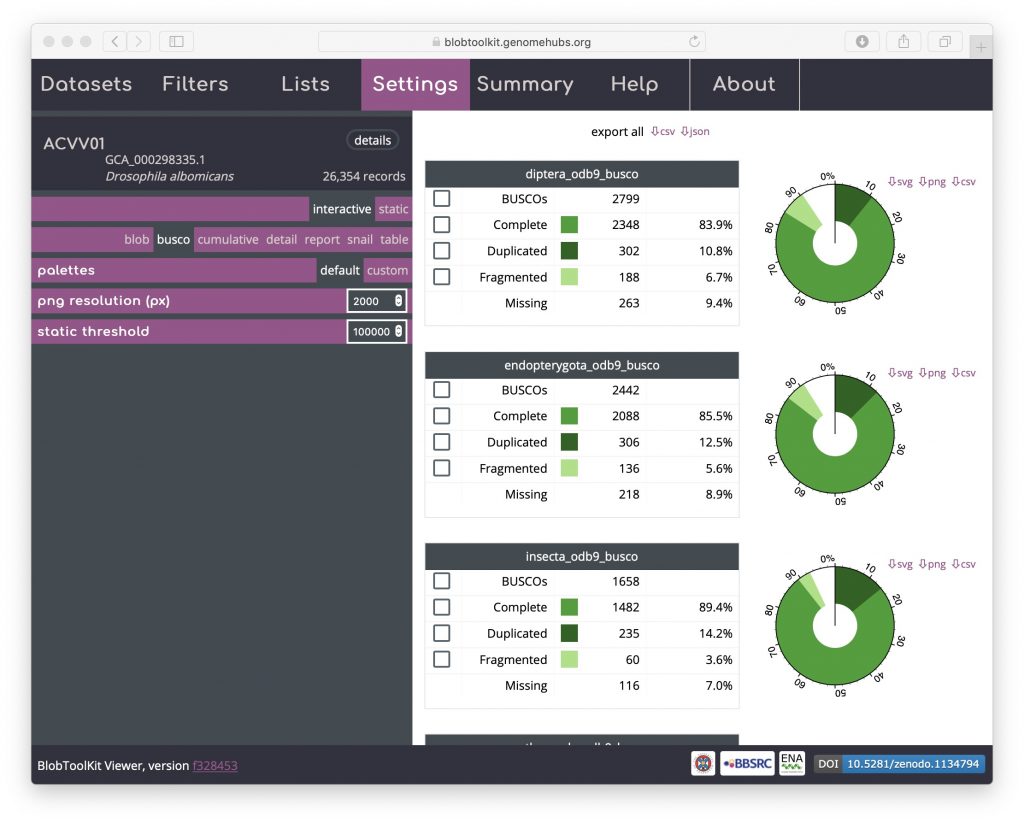
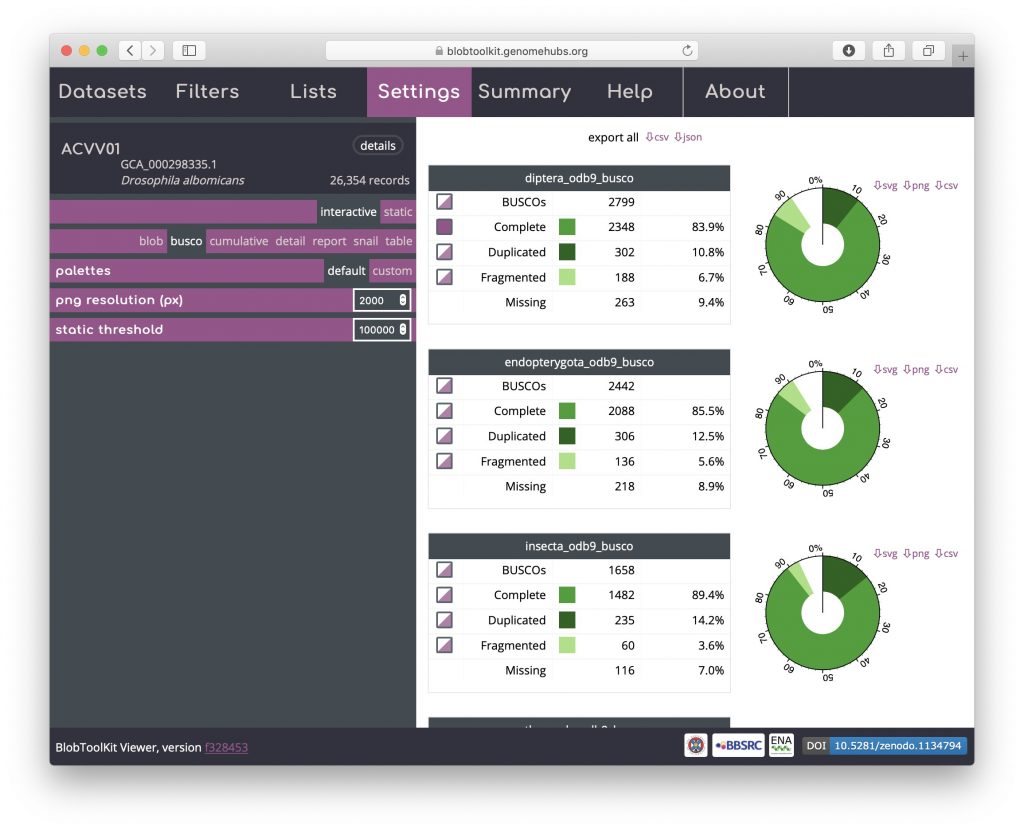
Select all scaffolds that have a complete BUSCO gene in the diptera_odb9 set by clicking the checkbox to the left of the word “Complete” in the top table of BUSCO results. Other checkboxes will be half-filled, showing that the selection includes a subset of scaffolds in these categories as well:
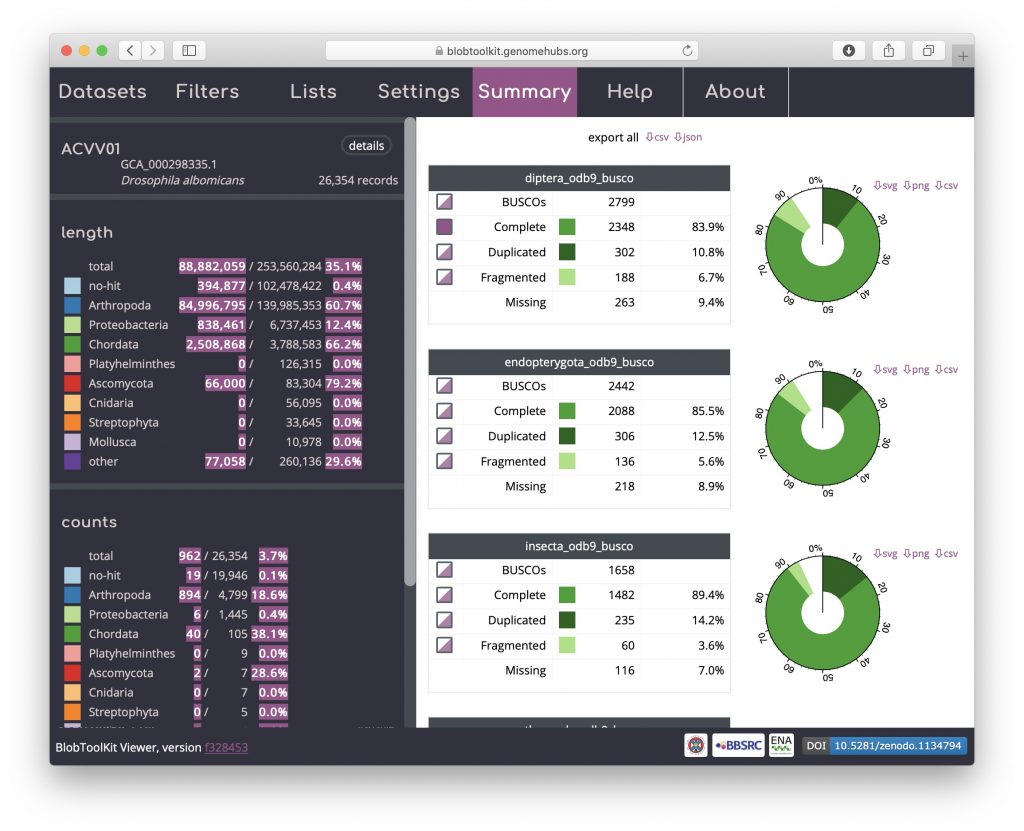
Click on the “Summary” tab to see a summary of the portion of the genome included in this selection. The values for the selected scaffolds (highlighted in pink) show that the selection includes around 35% of the total assembly with over 60% of the assembly span assigned to the phylum Arthropoda, but only 3.7% of the total number of scaffolds:
To see the distribution of these scaffolds on the blob plot, select “blob” in the settings menu. Here a number of bins have a pink outline showing that some of the scaffolds in that bin have been selected. Most of these bins are clustered around the peak of scaffolds assigned to Arthropoda, however four bins have somewhat higher GC and form a separate cluster:
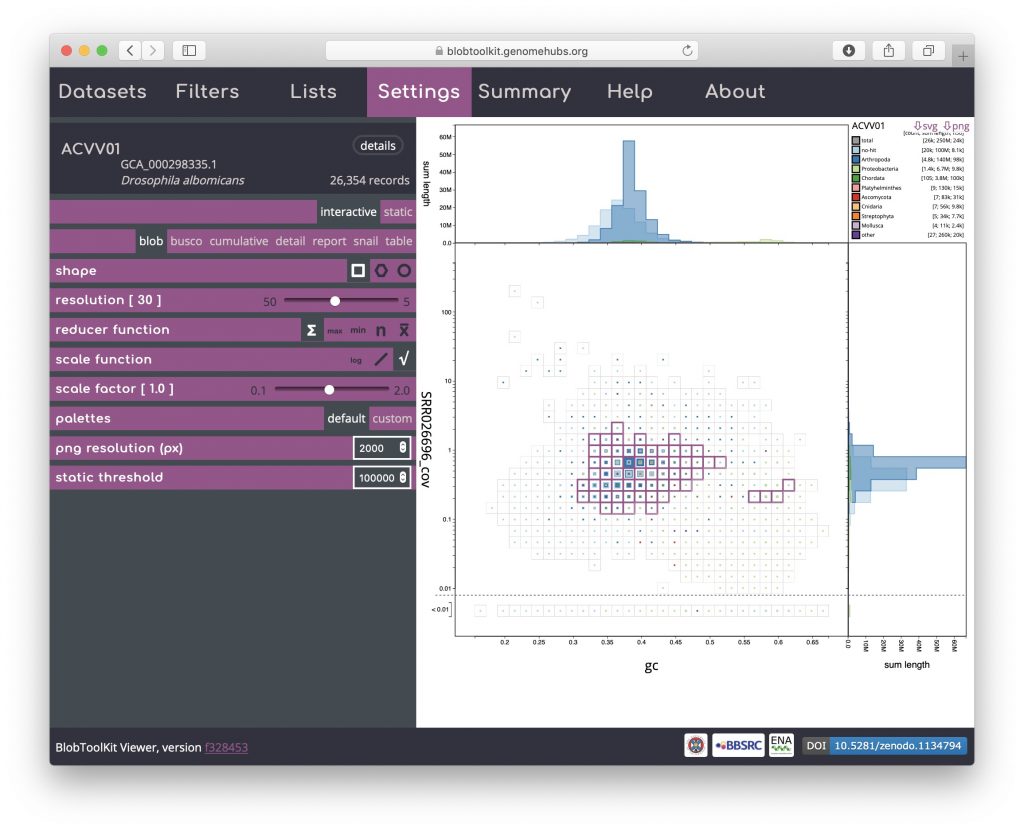
To investigate these further, open the Filters menu and set the minimum GC value to 0.55 (see Filtering assemblies):
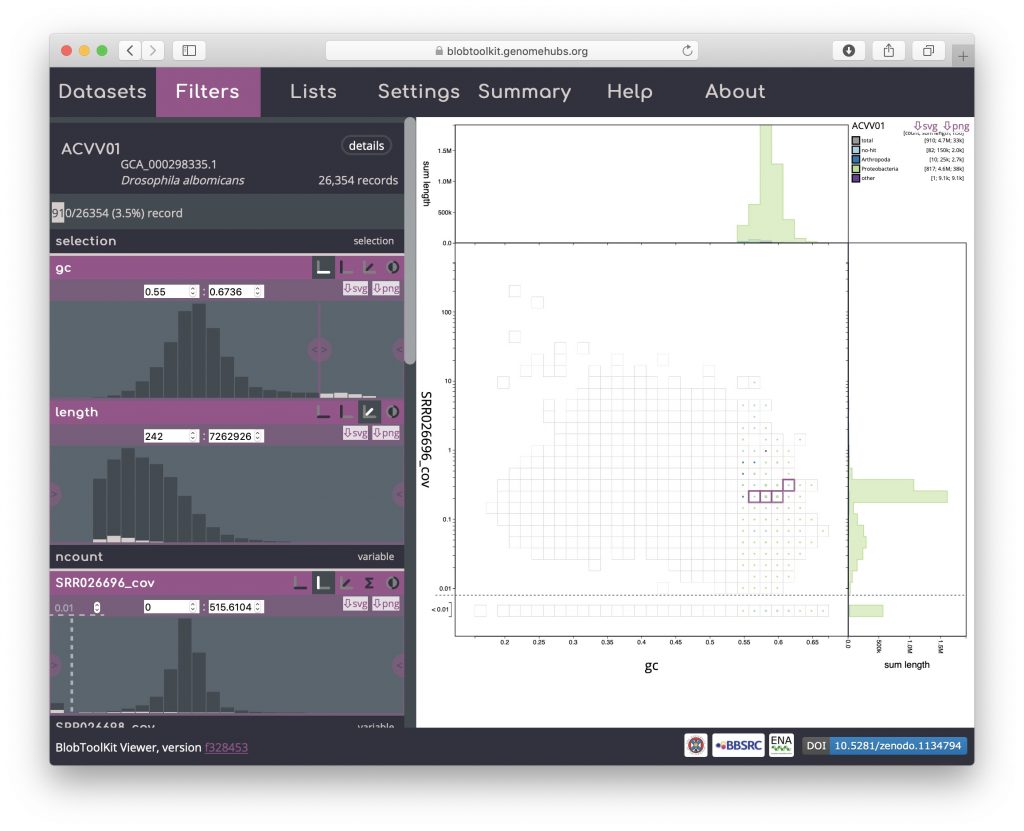
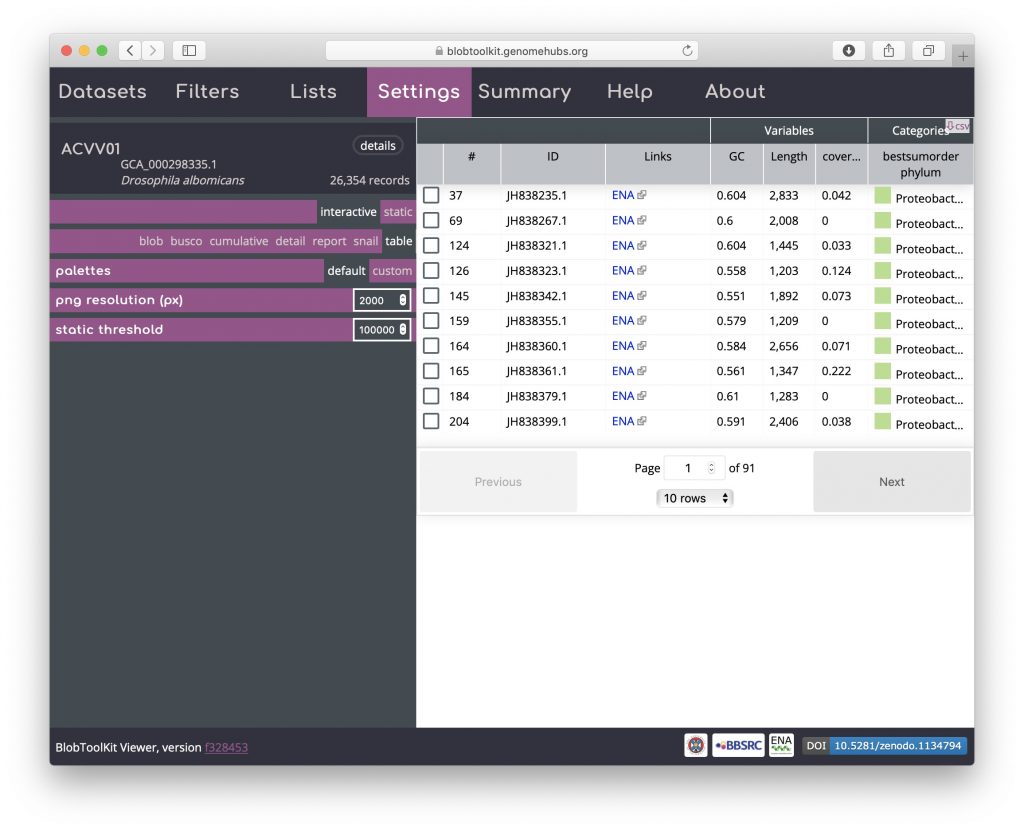
Then return to the Settings menu and select the table view:
Click on the table header above the checkboxes in the left-hand column to sort selected scaffolds to the top of the list:
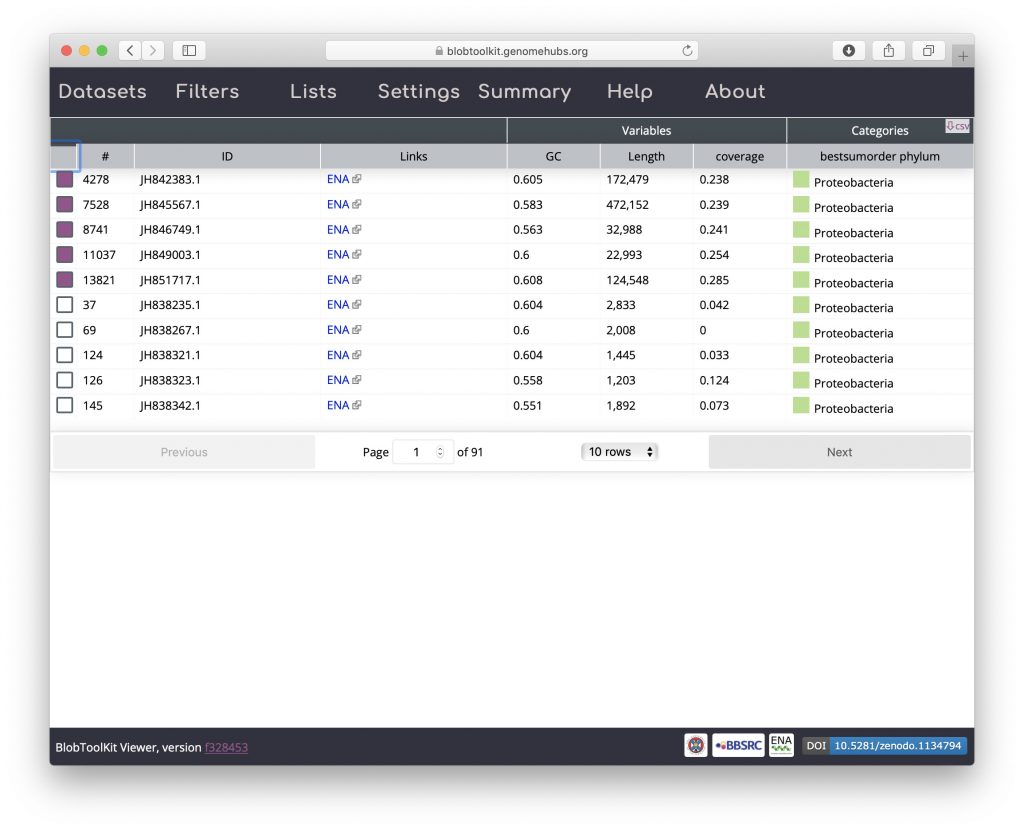
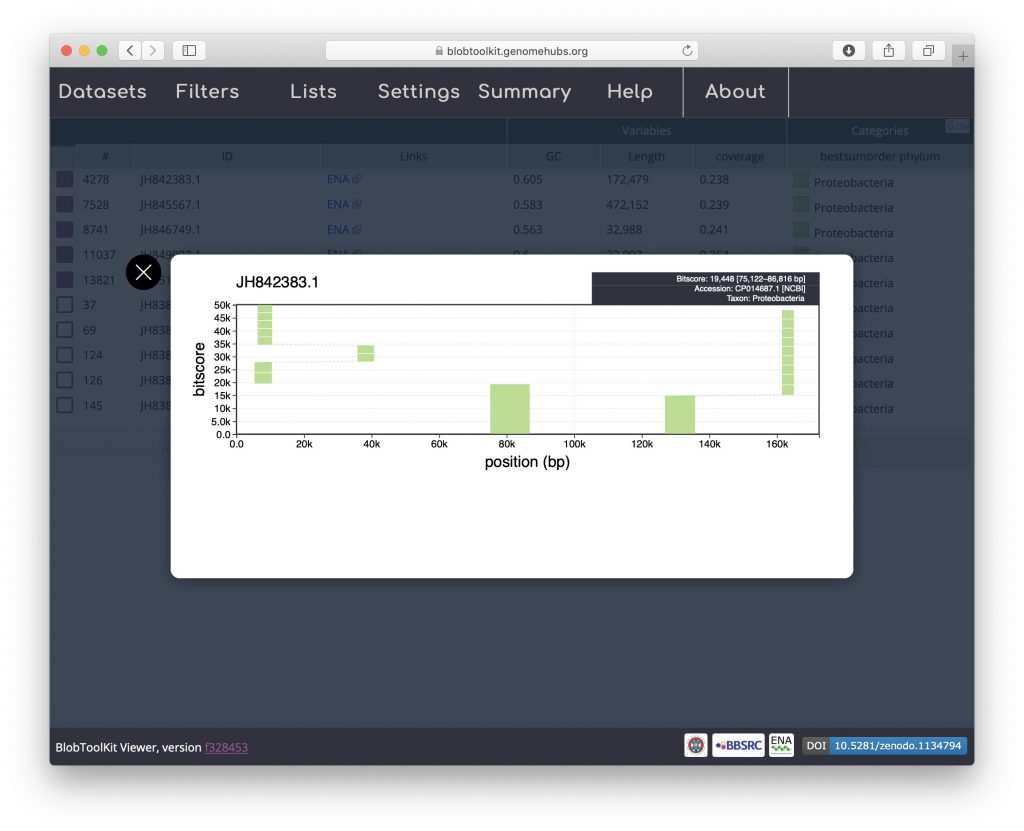
All of the selected scaffolds are labelled Proteobacteria suggesting that these BUSCO genes are present in a Wolbachia endosymbiont of Drosophila albomicans. Click on one of the coloured squares in the Categories column to see the distribution of BLAST hits that the taxonomic assignment is based on and for links to gene records in the NCBI database:
